Felix Krause
Co-Founder of contextsdk.com
Founder of fastlane.tools

While I leverage AI for my work, all my blog posts are handcrafted.
How I put my whole life into a single database
Back in 2019, I started collecting all kinds of metrics about my life. Every single day for the last 2.5 years I tracked over 100 different data types - ranging from fitness & nutrition to social life, computer usage and weather.
The goal of this project was to answer questions about my life, like
- How does living in different cities affect other factors like fitness, productivity and happiness?
- How does sleep affect my day, my fitness level, and happiness?
- How does the weather, and the different seasons affect my life?
- Are there any trends over the last few years?
- How does computer time, work and hours in meetings affect my personal life?
Since the start of this project, I collected a total of more than 380,000 data points.
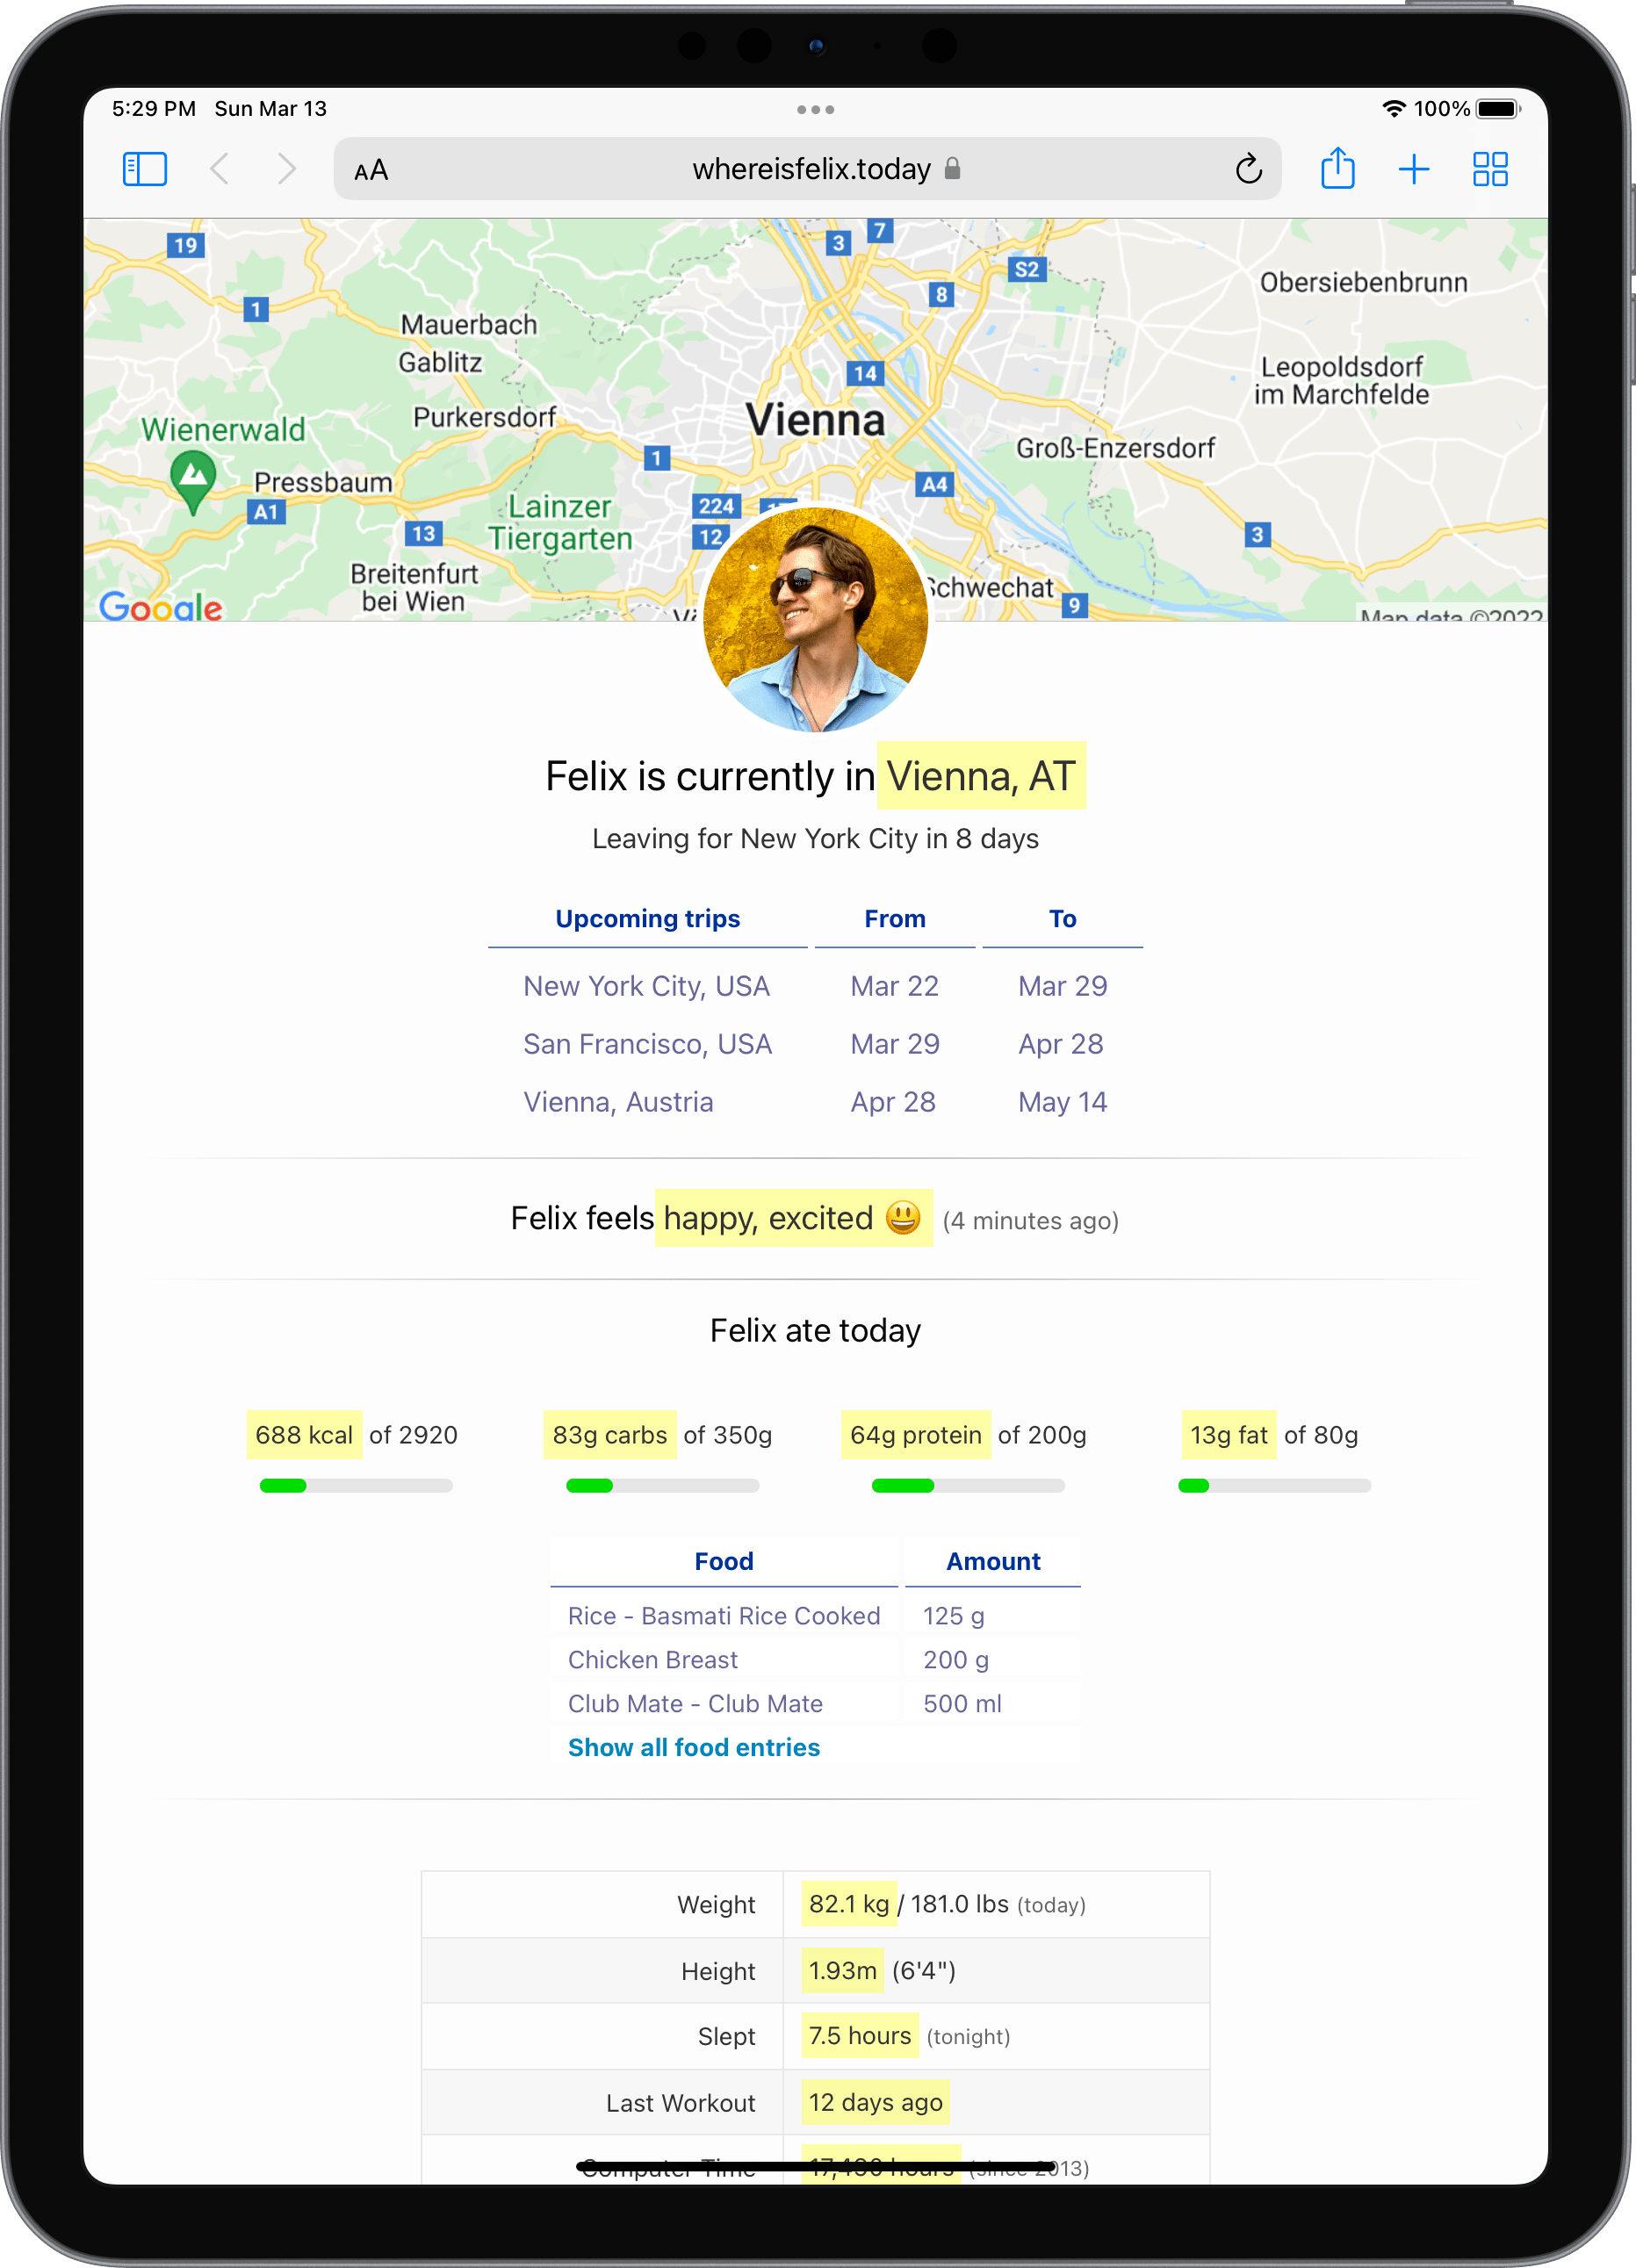
Naturally after I started collecting this data, I wanted to visualize what I was learning, so I created howisFelix.today. Initially, the domain whereisFelix.today (now renamed to howisFelix.today) started as a joke to respond to friends asking when I’d be back in NYC or San Francisco. Rather than send them my schedule, I’d point them to this domain. However, now it’s more than my location: it’s all of me.
Rules I setup for the project
- Use a single database, owned and hosted by me, with all the data I’ve collected over the years
- Be able to easily add and remove questions on the fly, as I learn what’s beneficial to track
- Full control of how the data is visualized
- Works well for frequent flyers with mixed time zones
- 100% fully open source, MIT licensed and self-hosted
I selected 42 graphs to show publicly on howisFelix.today
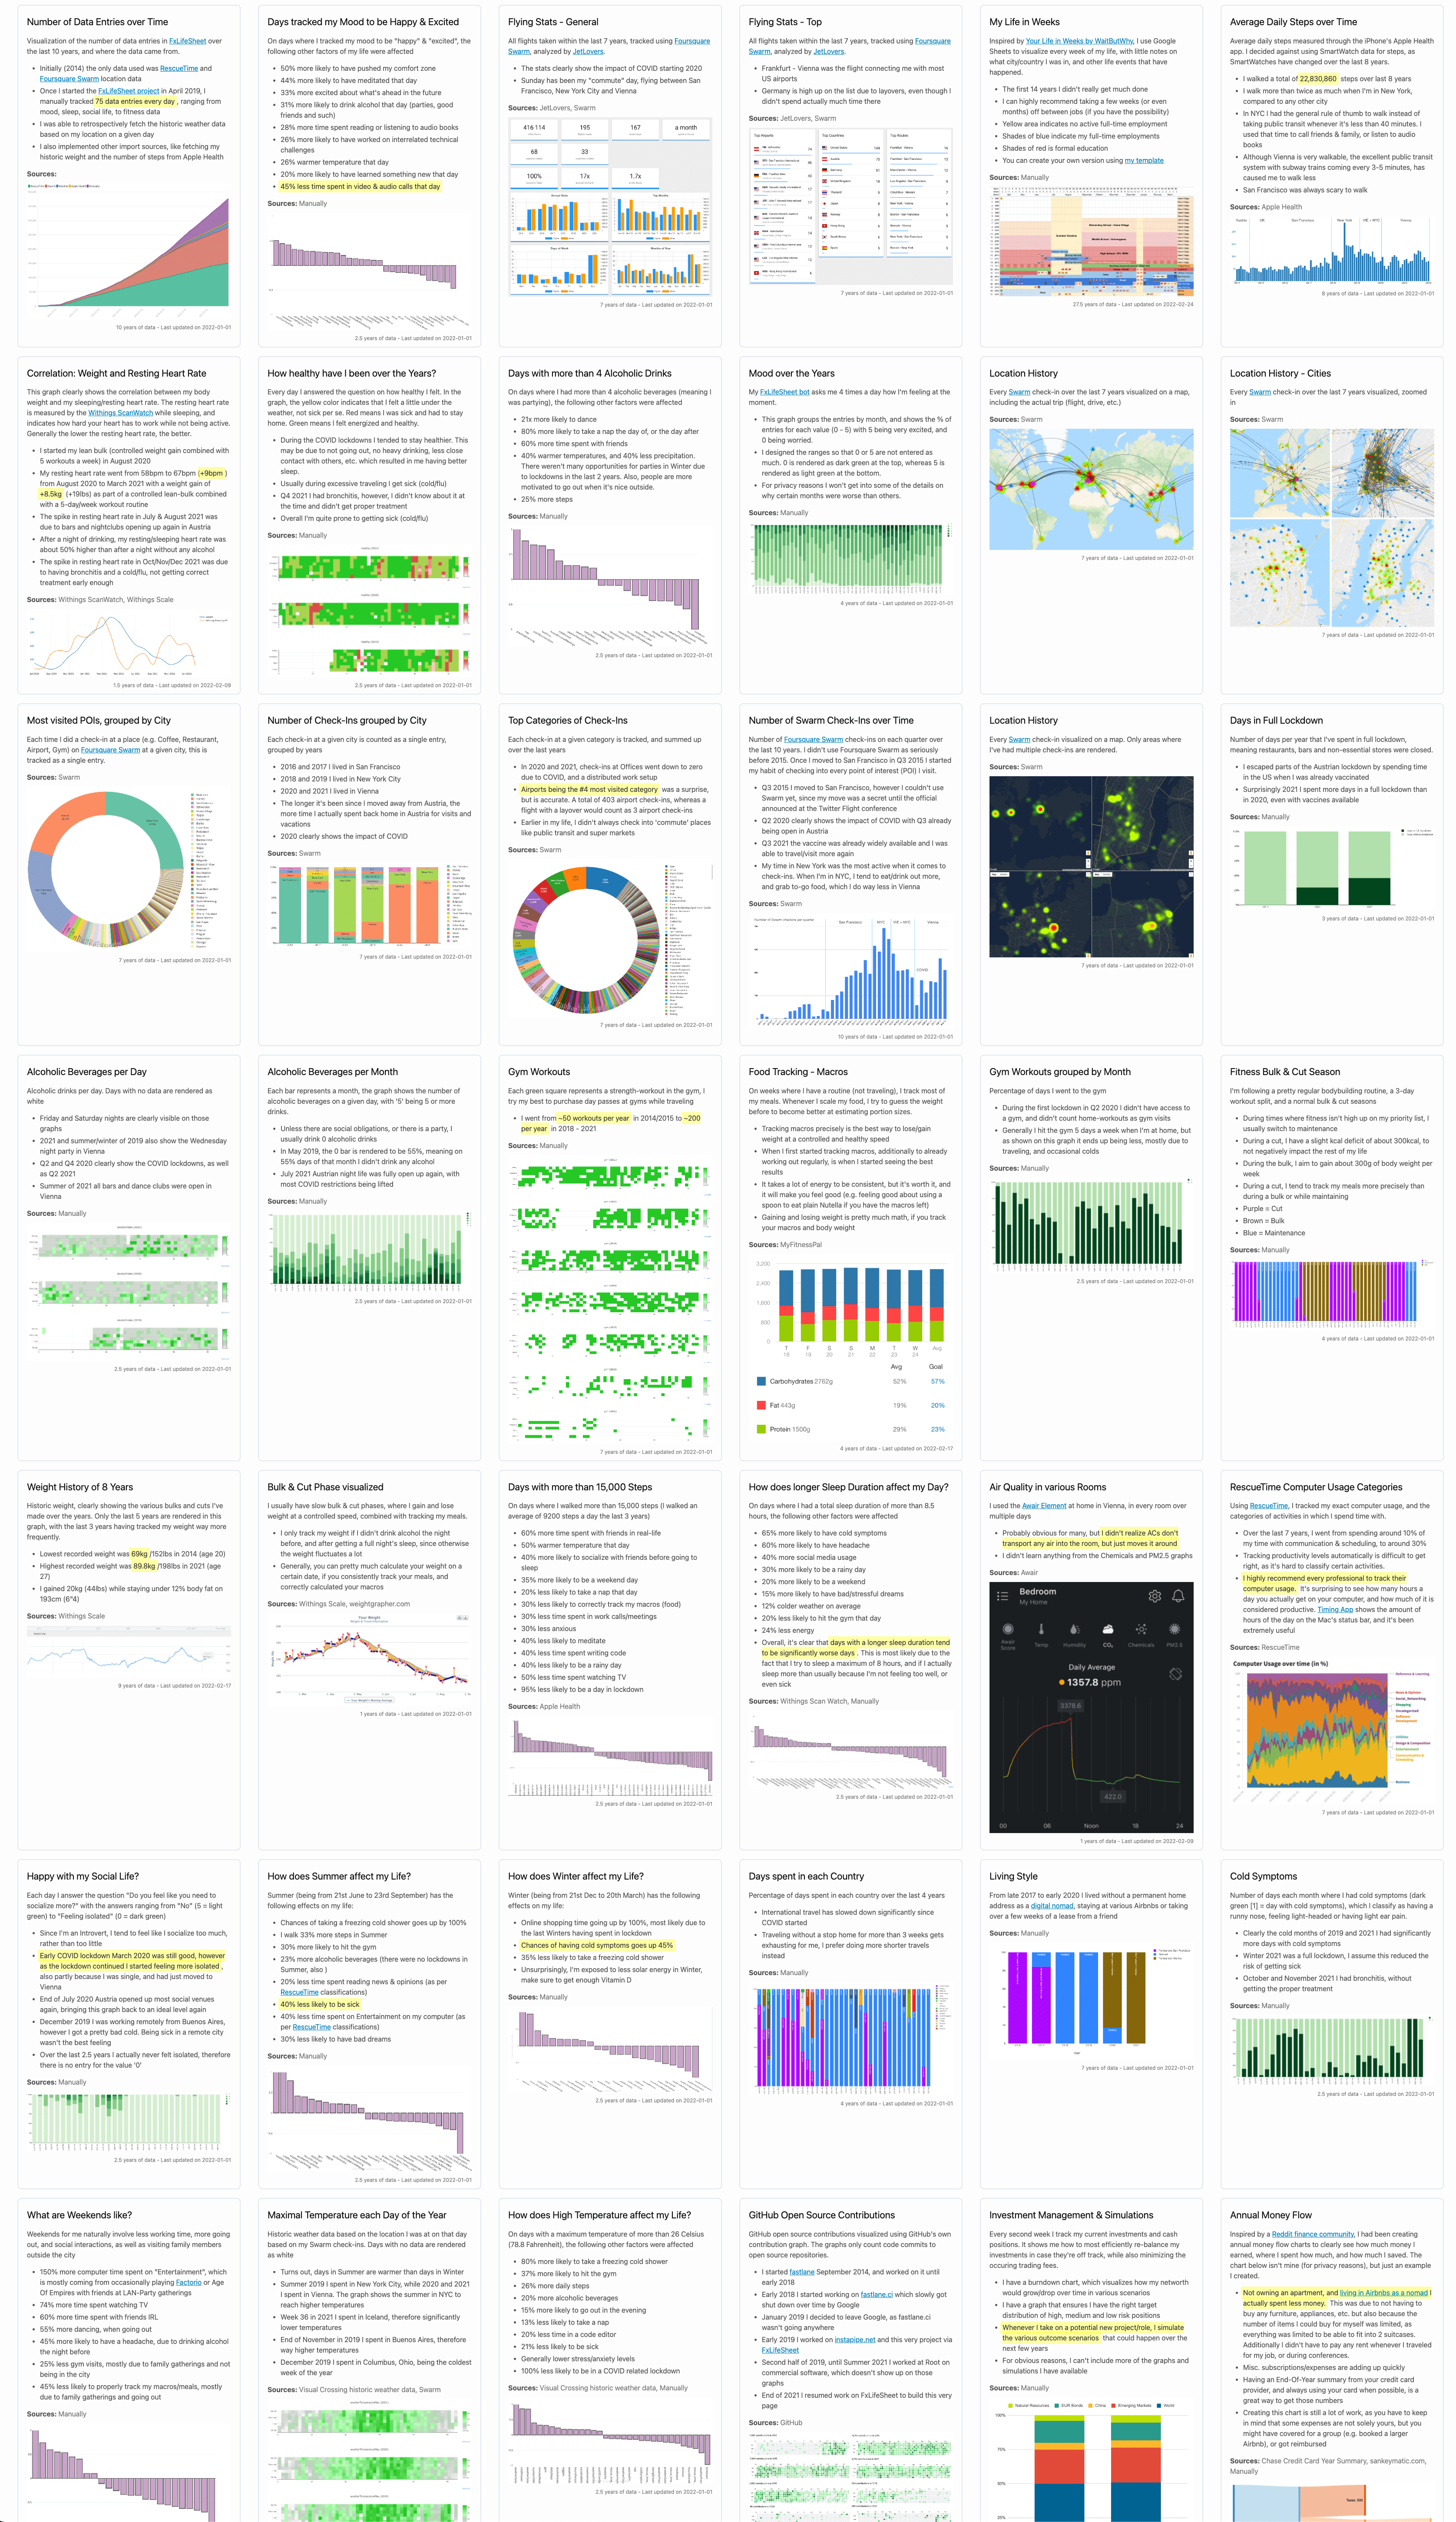
Check out howisFelix.today to see all graphs and data I’ve created with this project, as well as details about how you can use this project for yourself. You can check out the full source code on KrauseFx/FxLifeSheet.
Tags: quantified-self | Edit on GitHub