Felix Krause
Co-Founder of contextsdk.com
Founder of fastlane.tools

While I leverage AI for my work, all my blog posts are handcrafted.
Analyzing your public GitHub contributions using Google Big Query
Do you like those GitHub graphs, but want to know even more about your open source behavior? GitHub has you covered with githubarchive.org. GitHubArchive offers dumps of all GitHub events of all users and open source projects. New ones are generated every single day, and are instantly accessible. They are very easy to use together with Google Big Query.
If you have a Google Cloud account & project, click this link to give it a try. Use the Run Query button and wait for about 30 seconds, and you’ll get a list of people that comment on any of the fastlane repos most often in the year of 2017 (see screenshot below):
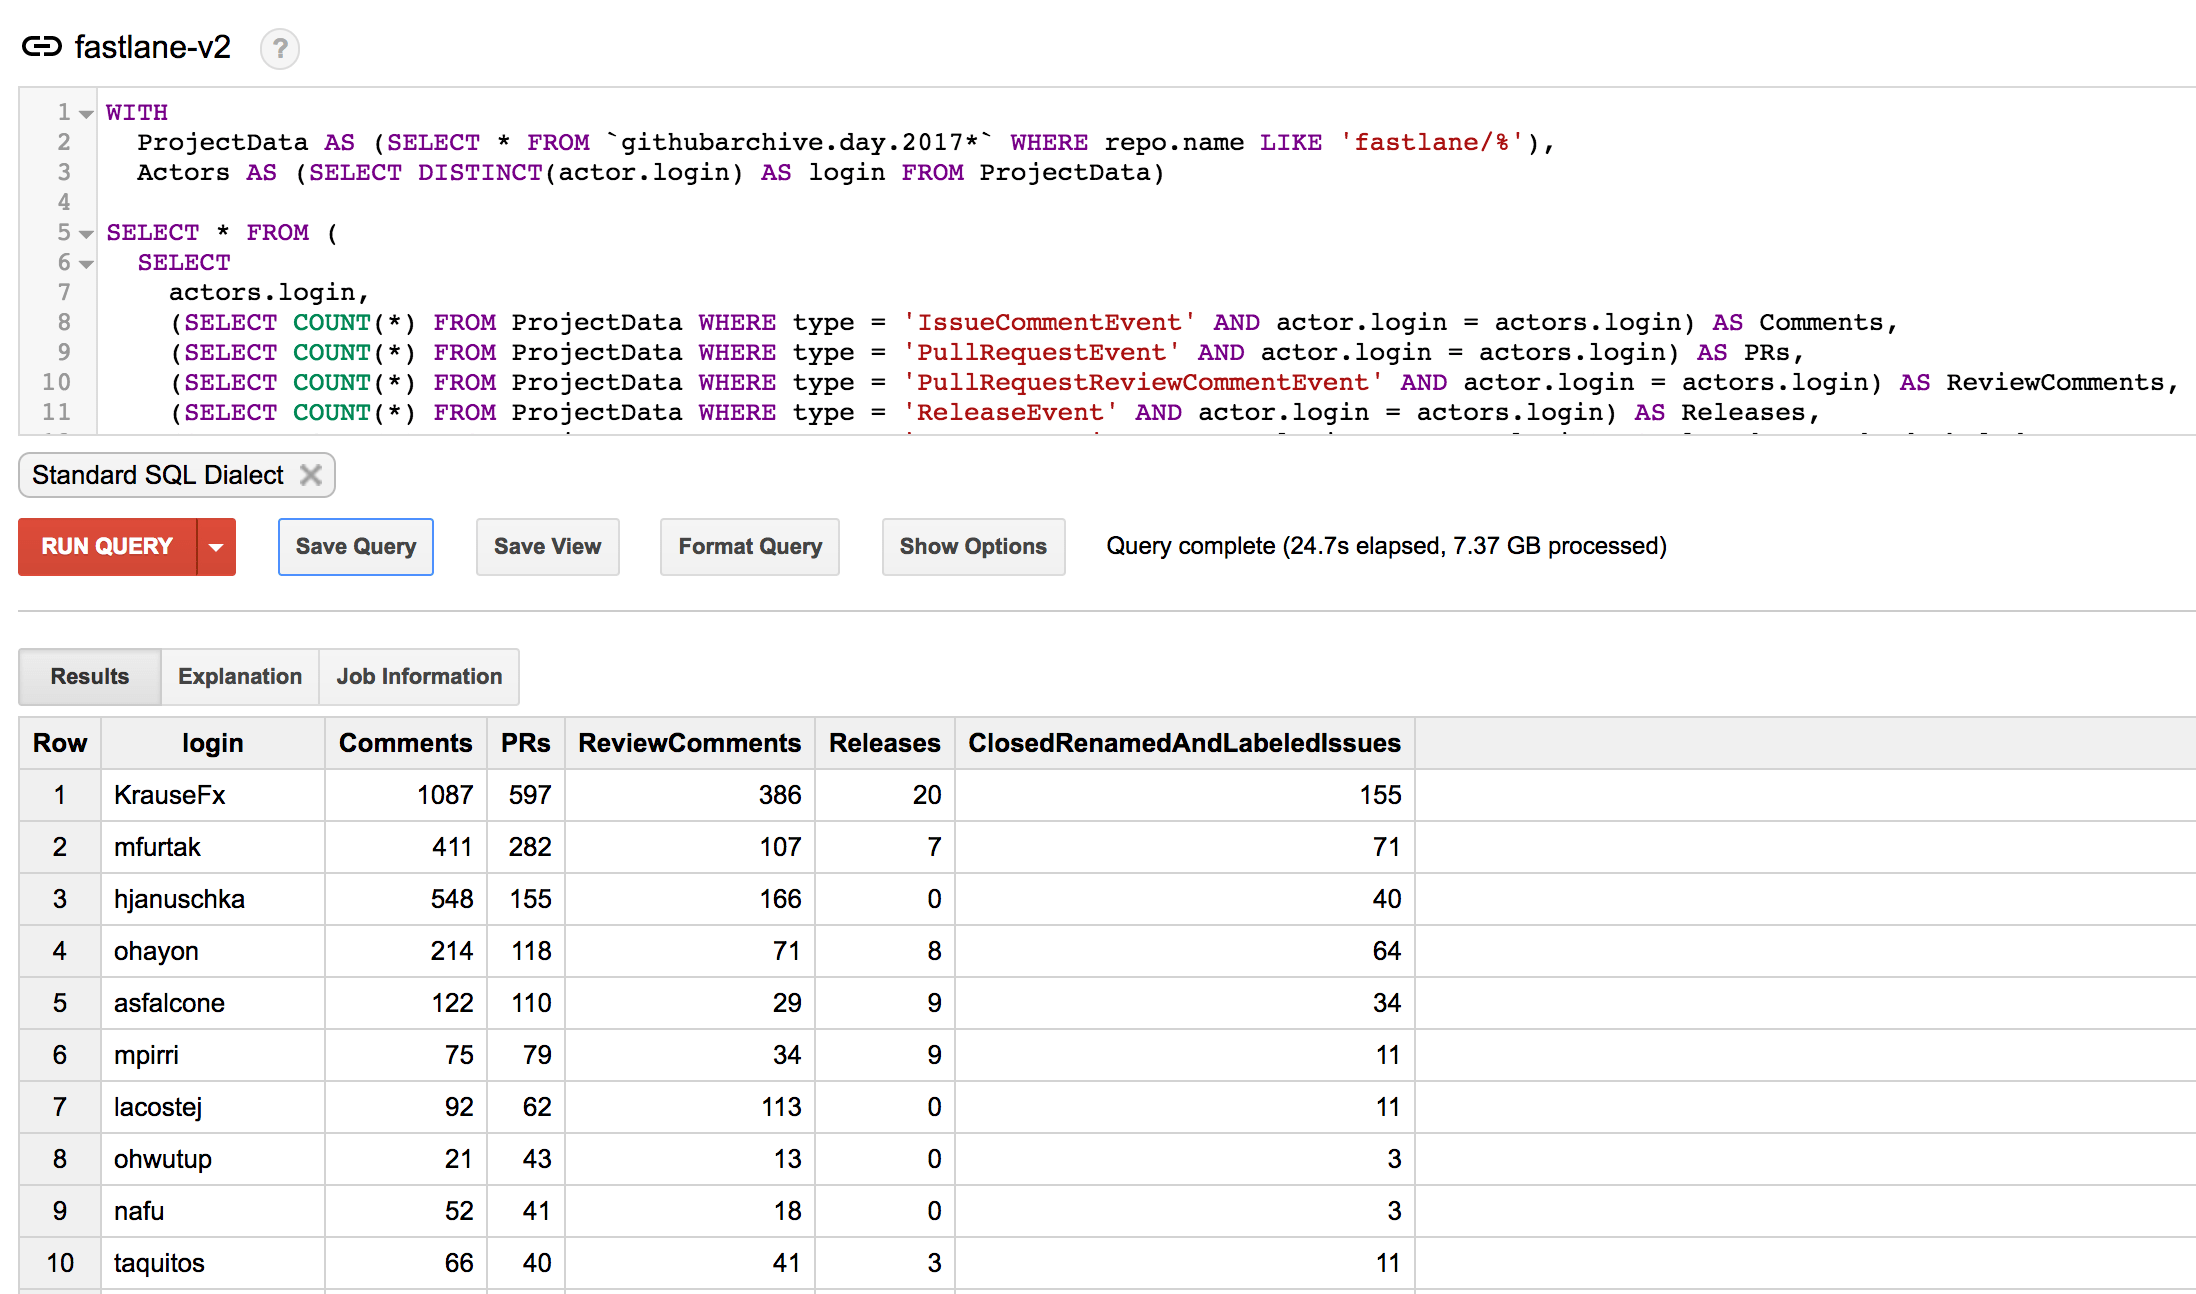
To run this query for your own GitHub organization, just replace the “ fastlane/%” with your own GitHub org. You can also easily extend the query to show more columns (see the list of available events).
Running queries on your own profile
I was wondering of how my GitHub behavior changed over the last few years, now that fastlane is actively being used by tens of thousands of companies, it’s harder to keep the innovation you had in the beginning.
The last 3 years I published a total of
- 16,000 comments
- 5,550 Pull Requests
- 907 releases
across a high number of different open source projects, mostly fastlane, TSMessages, danger and lots of other projects.
Below you can see the last 5 years of open source code contributions:
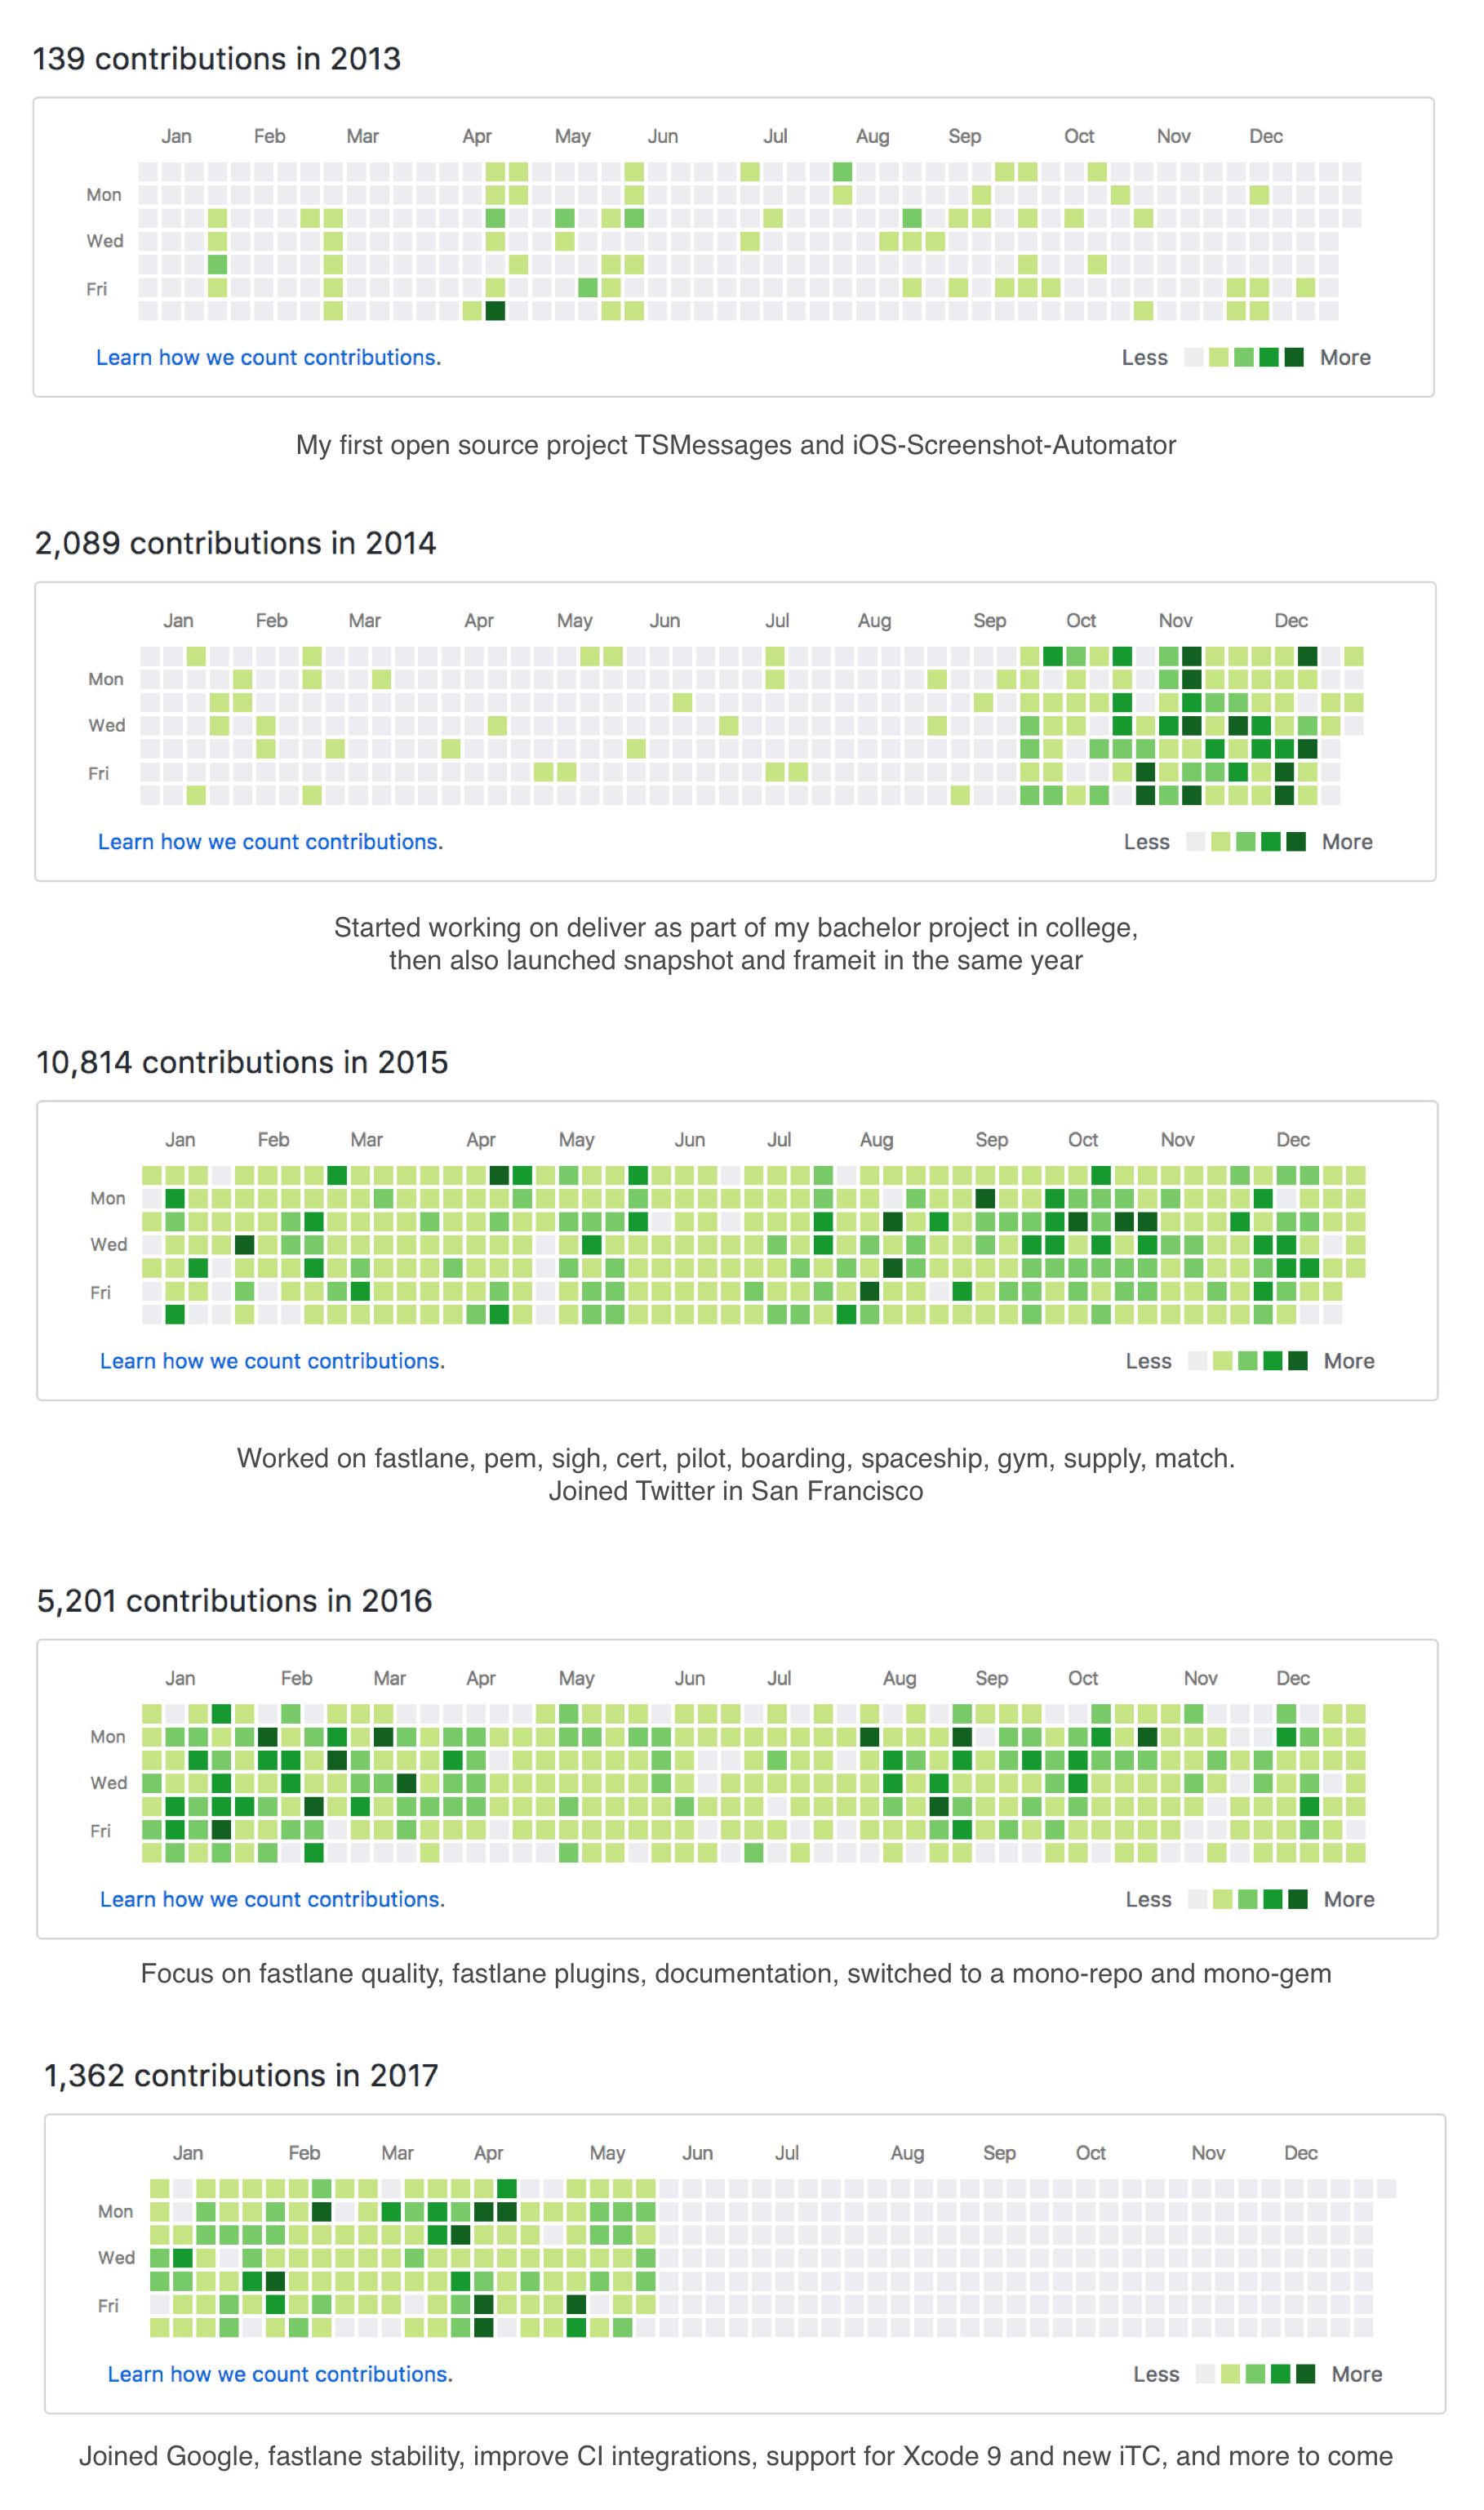
Over the last 3 years, on average I did the following every single week
- Post 77 comments on GitHub Issues
- Submit 28 Pull Requests(the first year of fastlane, I didn’t submit PRs on my own repos)
- Posted 16 comments on GitHub Pull Requests
- Published 5 fastlane releases
Wrapping up
You can extend those queries to show you more information that’s relevant to you. I initially wanted to use this to see which of our contributors are the most active, and make sure we promote them to be Core Contributors.
There has been quite some discussion around the GitHub graph (e.g. isaacs/github#627), as many engineers took it far too seriously and tried to have a long streak without any interruptions. GitHub reacted to the feedback and removed the streak count from all profiles, and added an option to show private contributions on the graphs.
Special thanks to @sebmasterkde for coming up with the initial queries.
Note: The data shown above is from May, as that’s when I wrote this blog post, but was kind of distracted with more important things (life and such) and finally found the time to publish this post.
/* GitHub query to get the number of comments, PR, releases, etc. for a given GH org */

WITH
  ProjectData AS (SELECT * FROM `githubarchive.day.2017*` WHERE repo.name LIKE 'fastlane/%'),
  Actors AS (SELECT DISTINCT(actor.login) AS login FROM ProjectData)

SELECT * FROM (
  SELECT
    actors.login,
    (SELECT COUNT(*) FROM ProjectData WHERE type = 'IssueCommentEvent' AND actor.login = actors.login) AS Comments,
    (SELECT COUNT(*) FROM ProjectData WHERE type = 'PullRequestEvent' AND actor.login = actors.login) AS PRs,
    (SELECT COUNT(*) FROM ProjectData WHERE type = 'PullRequestReviewCommentEvent' AND actor.login = actors.login) AS ReviewComments,
    (SELECT COUNT(*) FROM ProjectData WHERE type = 'ReleaseEvent' AND actor.login = actors.login) AS Releases,
    (SELECT COUNT(*) FROM ProjectData WHERE type = 'IssuesEvent' AND actor.login = actors.login) AS ClosedRenamedAndLabeledIssues
  FROM Actors as actors
)
WHERE PRs > 0 OR Comments > 0
ORDER BY PRs DESC, Comments DESC;
Tags: open source, github | Edit on GitHub